I was wondering if anyone could explain me when and how correlated gamma emission in radioactive decay is used. In G4DeexParametersMessenger.cc I found the following command
/process/had/deex/correlatedGamma true/false
Which enables or disables the simulation of correlated gamma emission.
If I use this command in my macro (before /run/initialize) the corresponding line in the Radioactive Decay Physics Parameters is indeed changed. However, I don’t see correlations between the emitted gammas in the nuclear de-excitation. Before attempting my specific use-case I tried to verify this by looking at the most famous example, 60Co. I looked at the angle between the direction of the two gammas via the cross product and found no correlation.
I believe it would definitely be helpful to explain this topic in the user guide or elaborate upon this subject here on the forum because as far as I could see it is currently not included in the user guide and several people ran into similar issues before: Previous question 1 Previous question 2
It turns out I was too quick to open this topic, probably I was a bit more confident as usual due to the fact that multiple people reported this before and the lack of response. I’m now convinced Geant4 does take gamma-gamma correlations correctly into account, or at least for the 60Co decay.
Soon after writing this post I realized the effect of the solid angle conceals the usually reported angular correlation, i.e. W(theta) = 1 + 1/8 cos^2 + 1/24 cos^4 (or an equivalent expression).
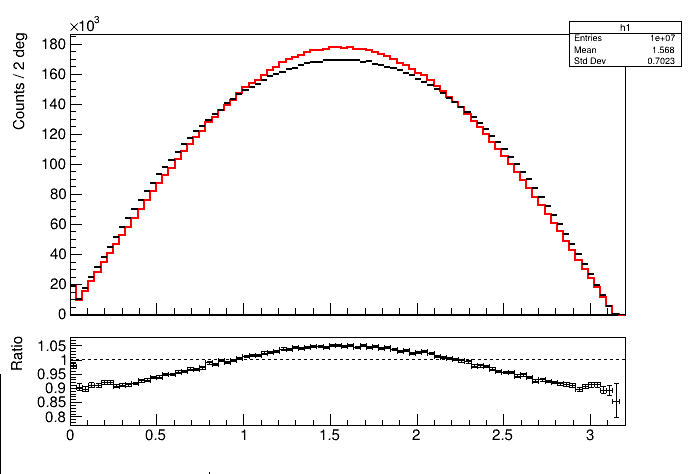
Taking the TRatioPlot between a simulation with /process/had/deex/correlatedGamma true (black) and false (red) confirms that Geant4 takes gamma-gamma correlations correctly into account:
Please find below a bit more information which hopefully solves your remaining questions.
1.) Ideally, shouldn’t the black curve, with angular correlations, be a uniform distribution, or is there still some correlation?
No, you don’t expect a uniform distribution due to the solid angle. I think you can easily convince yourself when looking at the area on a sphere at a given angle (see e.g. Area spherical cap). When plotting the expression you obtain you’ll see the red curve in my plot.
2.) If the X axis is theta (please correct me if not), then shouldn’t the W(theta) = 1 + 1/8 cos^2 + 1/24 cos^4 have minima around pi/2(~1.57)?
You’re two times correct, the X-axis is indeed theta and you indeed expect a minima around pi/2 whereas my plot shows a maximum. However, when reversing the order of the two histograms in the ratio plot you would get the expected result. Let’s say my choice of ordering the histograms was unfortunate. You could go one step further and try to fit the ratios with the above expression but I only cared about the relative difference at 90° and 180° which I checked to be correct (≈17%).
For the TRatioPlot I think you can best read the root page: TRatioPlot. I find it very helpful for a preliminary analysis of my data and simulations.